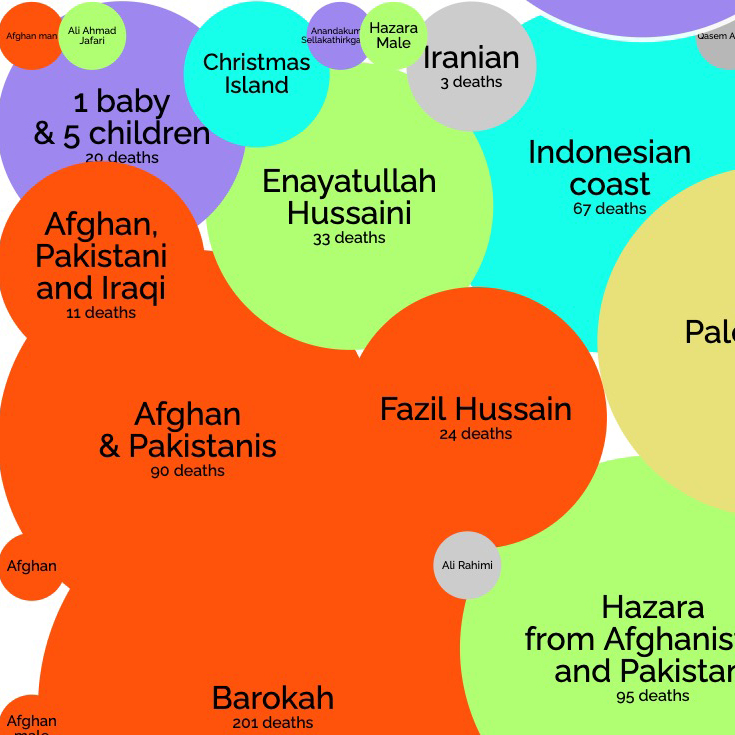
Okay. I cheated on this one - but it was worth it.
Inspired by David Mccandless and Information Is Beautiful, I wanted to visualise my own research and data. Not wanting to pay the insane licencing fee for their software, I decided "borrowed" it and reverse engineer it with my own data. (They really should obfuscate the code)
So... asylum seeker deaths and Politician property ownership using the smashed avo on toast price index. Nothing disturbing to see here. Carry on.
Tech
Javascript, Vizsweet

